
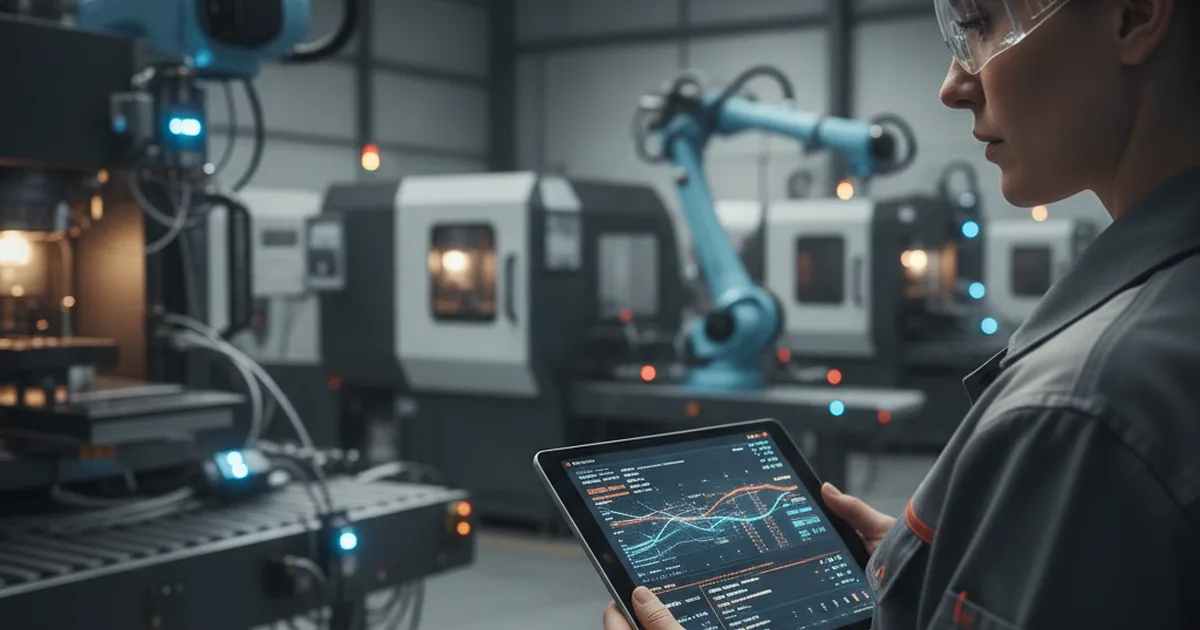
An OEM equipment monitoring portal is a customer-facing web layer that lets the buyer of a machine see its live status, condition, and alert history — distinct from the OEM's own internal SCADA or service tooling. The architecture moves data from an edge gateway through protocol translation into cloud storage, then exposes it through an API to a multi-tenant web dashboard. The decisions that matter most are build-vs-buy for the stack, OT-side security at the edge, and designing the dashboard around what the customer actually needs to act on, not everything the OEM's engineers can see internally.
OEMs that sell connected industrial equipment increasingly run into the same request from buyers: can we see how the machine is running without calling your service line or waiting for a technician to visit? The purchaser's maintenance team wants uptime data, the plant manager wants a status view they can check from a phone, and the OEM's own service organization wants the same telemetry stream to triage support calls before dispatching anyone. None of this is a new problem in industrial equipment, but the expectation that it should be self-service, through a web browser, has become table stakes rather than a differentiator.
The gap between wanting this and having it is rarely the sensors. Most connected equipment already streams telemetry somewhere; what's missing is the web application layer that takes that stream and turns it into something a non-technical customer can log into, trust, and act on. That's a different skillset than designing machines or writing control-system firmware, which is why most OEMs end up working with a web development team that can turn that telemetry stream into a secure, branded customer portal rather than trying to build it with the same engineers who built the machine's control logic.
This guide covers what a customer-facing OEM monitoring portal actually is, how data flows from the machine to the browser, three ways to architect the build-vs-buy decision, the security posture the portal needs where it touches OT networks, what the dashboard itself should contain, why factory-operator and OEM-customer needs diverge, and how to scope a rollout from a handful of pilot machines to a fleet of a hundred or more.
What Is an OEM Equipment Monitoring Portal?
An OEM equipment monitoring portal is a web application, built and operated by the equipment manufacturer, that gives the end customer who purchased a machine authenticated, self-service visibility into that machine's operating status, condition, and alert history. It typically shows uptime, key operating parameters, maintenance due dates, and recent fault or warning events: the subset of telemetry a customer needs to make decisions, not the full diagnostic interface an engineer would use to troubleshoot the machine's control system.
This is a different thing from the OEM's own internal SCADA or HMI tooling. Internal systems are built for the OEM's own engineers and service technicians to configure, calibrate, and deeply diagnose a machine during manufacturing or a service visit, and they typically expose far more raw detail than any customer needs or should see. A monitoring portal is a deliberately narrower, simplified layer on top of the same underlying data, built for a different audience with a different job to be done, and permissioned so a customer only ever sees their own equipment.
Edge-to-Cloud Architecture: How Machine Data Reaches the Portal
The portal itself is the last and simplest stop in a longer data path. Understanding that path matters, because most of the architecture decisions (and most of the things that go wrong) happen before the data ever reaches the web layer.
Edge Gateway and Protocol Translation
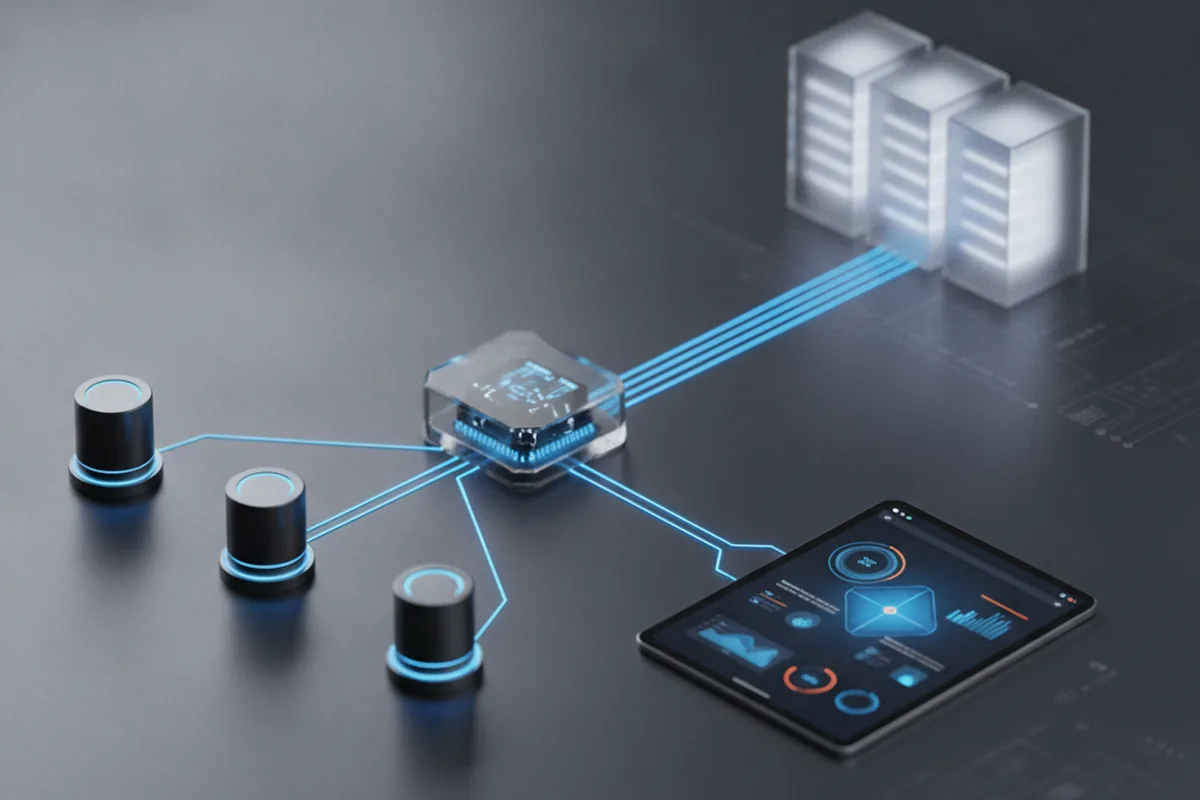
Most industrial machines speak a protocol native to their control system (Modbus, OPC UA, or a vendor-specific variant) that cloud platforms and web APIs don't consume directly. An edge gateway sits physically close to the machine, translates that native protocol into a standard transport format such as MQTT or HTTP, and forwards it upstream. This is also where basic edge logic lives: filtering noisy sensor readings, batching data to reduce bandwidth, and buffering locally if the network connection to the cloud drops, so a brief outage doesn't silently lose data the portal would otherwise show as a gap.
Cloud Ingestion, Time-Series Storage, and the Portal's API Layer
Once data reaches the cloud, it lands in a time-series database optimized for the kind of query a monitoring portal actually runs, such as "show this machine's temperature over the last 30 days," not relational joins across unrelated tables. The portal's web front end never queries that storage layer directly; it talks to an API layer that handles authentication, scopes every query to the requesting customer's own machines, and shapes the raw time-series data into the summaries and charts the dashboard displays. Keeping this API boundary strict is what lets the OEM change the underlying IoT platform later without rewriting the customer-facing application, a point covered further in the FAQ below.
Build vs. Buy: Comparing Three Architecture Approaches
OEMs generally land on one of three architectural patterns, and the right one depends less on budget than on how much the OEM cares about owning the customer-facing brand experience.
| Approach | What it is | Best fit |
|---|---|---|
| Off-the-shelf IoT monitoring SaaS | A packaged platform handles gateway, cloud, and a pre-built customer dashboard | Fast launch, standard equipment types, limited branding needs |
| Fully custom stack | OEM builds gateway, cloud ingestion, storage, and web front end in-house | Large connected-equipment fleets where the ongoing platform investment pays for itself |
| Hybrid | Third-party platform for device management and time-series storage, custom web front end for the portal | Most OEMs — full brand and UX control without owning IoT infrastructure |
The hybrid approach is worth calling out specifically because it's the one most OEMs underrate early on. It avoids the multi-year investment of building device management and time-series infrastructure from scratch, while still giving the OEM a fully branded, white-label dashboard that looks and behaves like part of their product line rather than a reseller's generic interface. It also keeps the front end decoupled enough from any single vendor that switching the underlying platform later is a backend migration, not a full portal rebuild.
Security Considerations for OT-Connected Portals
A customer-facing portal is, by definition, an internet-facing application connected, if only indirectly, to equipment that may sit on or near an OT network. That makes its security posture a design decision, not an afterthought bolted on before launch.
Data should flow in one direction only: out from the machine, through the edge gateway, to the cloud. The portal and its API should never have a write path back down into the machine's control logic. Monitoring and control are different problems, and collapsing them into the same channel turns a dashboard outage or compromise into a potential safety issue. Network segmentation at the gateway level keeps the portal's internet-facing surface from having any direct route into the plant's broader OT network, even if the specific machine it monitors sits inside one.
On the application side, every customer account needs to be strictly scoped to their own equipment. A multi-tenant portal where one customer could, even accidentally, see another customer's machine data is both a trust failure and, depending on the industry, a contractual one. This isolation needs to be enforced at the API and query layer on every request, not assumed from login alone, since the most common tenant-isolation bugs show up in secondary features like exports and reports rather than the main dashboard view.
What Should the Customer-Facing Dashboard Include?
The dashboard's job is to answer three questions a customer actually asks, not to replicate everything the OEM's own engineers can see: is my equipment running normally right now, has anything gone wrong recently, and what do I need to do about it. In practice that maps to a small, consistent set of elements:
- A real-time status view (running, idle, fault) for each machine
- A history of alerts and downtime events with enough context to understand what happened
- Threshold-based alerts the customer can configure for conditions that matter to their operation
- A simple export or report function a site manager can hand to their own maintenance team or include in an internal review
Resisting the urge to expose every parameter the OEM's internal engineers care about is as important as deciding what to include. A dashboard that mirrors an internal diagnostic tool overwhelms a non-technical customer and buries the handful of signals that actually drive a decision. It's the same discipline covered in our guide to industrial API gateway architecture, where the API layer's job is to shape raw data for its consumer rather than pass everything through unfiltered.
Factory Operator vs. OEM Portal Needs: Why They're Different
It's tempting to treat a customer monitoring portal as a smaller version of the kind of plant-wide SCADA or MES dashboard a factory operator uses internally, but the two serve fundamentally different jobs.
| Need | Factory operator | OEM customer |
|---|---|---|
| Scope of visibility | Entire production line, across many equipment vendors | Only the machines they bought from this OEM |
| Level of detail | Deep diagnostic parameters, engineering-level detail | Simplified status, alerts, and uptime reporting |
| Data isolation requirement | Internal to one company's own network | Must never see another OEM customer's equipment data |
This is why an OEM building its own portal shouldn't simply shrink its internal engineering tools down to a customer view. The data model, permission structure, and even the vocabulary used in the UI need to be designed from the customer's job to be done outward, not from the engineering system inward.
Scoping a Rollout: From Pilot to 100+ Connected Machines
A monitoring portal rollout should scale in deliberate stages rather than launching for the full installed base at once.
- Pilot with five to ten machines at customer sites with a good working relationship, to validate the data model against real telemetry rather than lab conditions.
- Confirm the edge-to-cloud path end to end, including protocol translation, network reliability, and buffering behavior during an actual connectivity drop, before adding more machines.
- Build out the dashboard around pilot feedback, since customers often want fewer, more focused views than the OEM initially assumes.
- Expand in waves by equipment model or region, so any gateway or integration issue found at scale affects a bounded group, not the entire fleet.
- Scale ingestion and storage capacity ahead of fleet growth, not reactively. Time-series data volume grows roughly linearly with connected machine count, and that's a predictable cost to plan for rather than discover.
- Monitor portal adoption, not just machine connectivity. A technically working integration that customers don't log into regularly hasn't actually solved the self-service problem it was built for.
The same data model that feeds the customer portal's alert history is often worth routing into longer-term storage for trend analysis later. Our guide to manufacturing data lake architecture covers how raw telemetry gets structured for that kind of retrospective analysis once a fleet is large enough to make it worthwhile. On the transport side, many OEMs standardize their edge-to-cloud messaging on the same protocol pattern covered in our MQTT and Sparkplug B guide, which solves the connection-state and data-typing problems a monitoring portal otherwise has to handle itself at the application layer.
Frequently Asked Questions
- Can a monitoring portal work if machines use different PLC brands?
- Yes, as long as the edge gateway layer handles protocol translation for each PLC brand separately before the data reaches the cloud. The portal itself only ever consumes a normalized data format, so it doesn't need to know whether the underlying machine speaks Modbus, OPC UA, or a proprietary protocol — that complexity is isolated at the gateway, not pushed up into the application layer.
- How is customer data isolated in a multi-tenant portal?
- Isolation typically happens at the API and database query layer, where every request is scoped to the authenticated customer's account ID, and machine records carry an owner field that's checked on every read. The riskiest failure mode is a report or export feature that bypasses this scoping, so tenant isolation needs to be tested explicitly for every new feature, not assumed from the authentication layer alone.
- Does the OEM need its own IoT platform, or can it use a third-party one with a custom front end?
- Most OEMs are better served by a third-party IoT platform for device management and time-series storage, paired with a custom web front end for the actual customer-facing portal. Building the entire stack in-house, including device provisioning and time-series infrastructure, rarely pays off unless the OEM's connected-equipment business is large enough to justify that ongoing investment.
- How long does a pilot deployment typically take?
- A pilot connecting five to ten machines, with a working gateway, a basic dashboard, and alerting for a handful of threshold conditions, typically takes six to twelve weeks. Most of that time goes into validating the data model against real machine telemetry, not into building the portal's UI, which is usually the smaller and more predictable part of the work.
- What happens to the portal if an OEM switches edge/cloud vendors later?
- If the portal's front end was built against a well-defined internal API rather than directly against a specific vendor's SDK, switching the underlying edge or cloud platform mainly affects the ingestion and storage layers, not the customer-facing application. This is the main argument for the hybrid build-vs-buy approach covered above — it keeps the OEM's brand and UX investment separate from any single vendor's platform.
- What's the difference between this portal and the OEM's own internal SCADA?
- Internal SCADA or HMI systems are built for the OEM's own engineers to run diagnostics and configure machines during manufacturing and service. A customer-facing monitoring portal is a separate, simplified application layer built for the end customer who bought the equipment — it exposes a narrow, permissioned slice of the same underlying telemetry, not the full engineering interface.
Whichever architecture an OEM chooses, the pattern that holds up over time is the same: keep the edge, ingestion, and storage layers swappable, and treat the customer-facing portal as a dedicated web application with its own API boundary, security model, and UX, rather than an afterthought bolted onto whatever IoT platform happened to be easiest to integrate first.
Building a customer-facing monitoring portal? Discuss Custom Web Portal Development →