
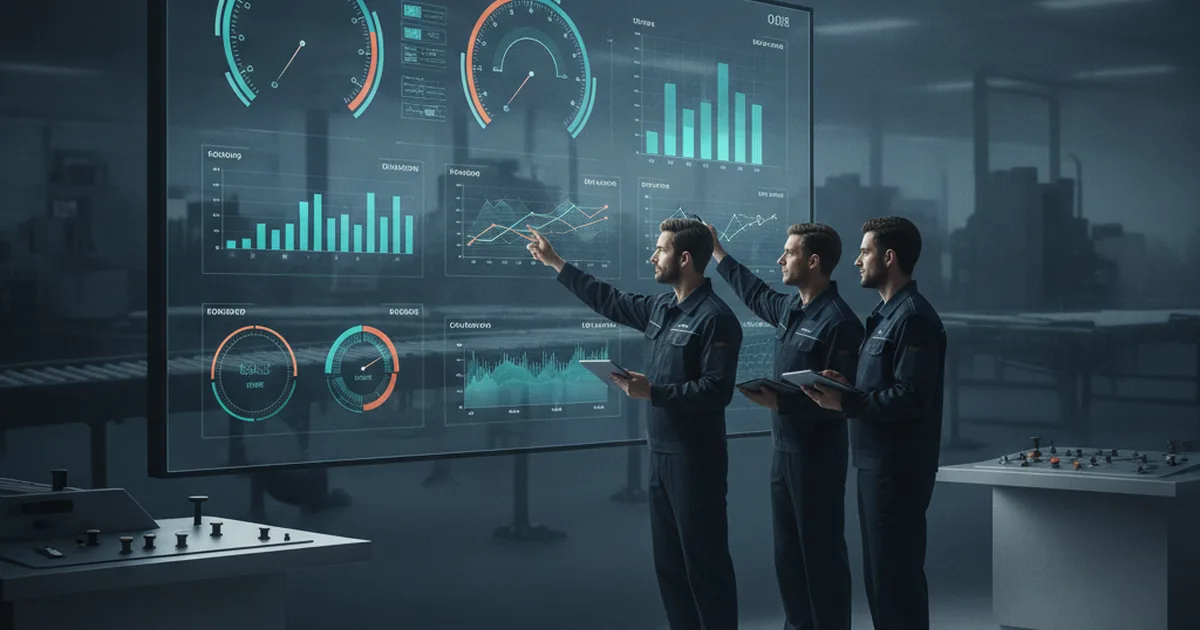
Off-the-shelf OEE dashboards show sensor data well but rarely integrate cleanly with a plant's existing MES, historian, or ERP — leading to duplicate data entry and numbers operators don't trust. A custom web-based OEE portal fixes that by putting the calculation engine in the plant's own backend, connected directly to its real systems, with role-specific views for operators, supervisors, and plant directors.
Most plants evaluating an OEE dashboard start by shopping vendor SaaS products — Evocon, iFactory, SCW.AI and similar platforms — because they promise a dashboard live within weeks. For a single line with no existing MES, that's often the right call. The problem shows up at plants that already run an MES, a historian, or an ERP: the SaaS dashboard pulls its own sensor feed and builds its own OEE number in its own cloud, which quietly diverges from the figure the MES already calculates. Now there are two sources of truth, and neither wins the trust of the floor.
That boundary problem is why some plants end up commissioning a team that specializes in building custom web dashboards tied directly into existing plant systems instead of adding another disconnected SaaS subscription on top of the stack they already have — the dashboard becomes one more view into data the plant already owns, not a second, parallel calculation nobody fully trusts.
This guide covers what an OEE dashboard actually needs to show, why off-the-shelf SaaS breaks at the ERP/MES boundary, a build-vs-buy decision table, the architecture of a custom web dashboard, a four-step rollout that protects operator trust, and how the two paths compare on cost over time.
What an OEE Dashboard Actually Needs to Show
Overall Equipment Effectiveness (OEE) is a single number built from three components multiplied together: Availability (how much scheduled time the equipment actually ran, after downtime), Performance (how close actual run speed came to ideal speed), and Quality (what share of output met spec without rework). A plant running at 90% availability, 95% performance, and 99% quality has an OEE of roughly 85% — multiplying the three, not averaging them, which is why a weak link in any one factor drags the whole number down fast.
The Core Widgets
The same handful of widgets show up across most dashboards, and for good reason — each answers a different question a shift supervisor actually asks:
- OEE gauge — the current composite number, color-coded against a target band.
- Plan vs. actual — scheduled output against what came off the line, by shift or day.
- Line/machine status grid — a running/stopped indicator across every asset, at a glance.
- Downtime Pareto — downtime reasons ranked by total minutes lost, usually the most actionable chart on the screen.
- Quality rate — rejects and rework as a share of output, trended over time.
This set is table-stakes — a dashboard missing any of these five is missing a question the floor will ask it. What differs isn't the widget list; it's where the numbers behind those widgets come from.
Why Off-the-Shelf OEE SaaS Breaks at the ERP/MES Boundary
A SaaS OEE dashboard is built to be generic: connect a sensor or PLC feed, run a standard calculation, display standard charts. That works cleanly for a plant with no other system of record. It works much less cleanly for a plant that already has an MES tracking work orders and quality holds, a historian logging process tags, or an ERP holding the production schedule the dashboard needs to calculate "plan" correctly.
When those systems already exist, a bolt-on SaaS dashboard usually ends up as a fourth data silo rather than a unifying view. Someone has to re-enter downtime reason codes that already exist in the MES. The plan figure comes from a manually synced schedule instead of the live one in ERP. And because the SaaS platform calculates OEE in its own cloud, using its own assumptions about shift calendars and ideal-speed values, its number can diverge from what the MES or a manual shift report already produces — at which point supervisors trust whichever number confirms what they already believed, and the dashboard stops being authoritative.
Signs You've Outgrown a Vendor Dashboard
- Downtime reasons get typed into the SaaS dashboard and the MES, and they don't always match.
- The "plan vs. actual" chart runs off a schedule nobody updated this week, disconnected from live ERP data.
- Supervisors quote the MES's OEE number in meetings and ignore the dashboard's, or vice versa.
- Adding a new line or site means another per-seat SaaS license, not a marginal extension of something owned.
Custom vs. SaaS OEE Dashboard — Decision Table
| Criterion | SaaS OEE dashboard | Custom web portal |
|---|---|---|
| Data from multiple systems | Limited to the vendor's supported connectors | Built to pull from MES, historian, ERP, and PLC/OPC UA together |
| Custom downtime-reason logic | Fixed to the vendor's taxonomy, with limited customization | Matches the plant's own reason codes and shift structure exactly |
| Data ownership | Stored and processed on vendor infrastructure | Owned outright by the plant, on its own historian |
| MES-API integration | Rarely native; usually a manual export/import workaround | Designed against the plant's actual MES API from the start |
| Cost of ownership, 3+ years | Predictable opex, but scales with every line and user added | Higher upfront cost, lower marginal cost per added line |
Architecture of a Custom Web OEE Dashboard
A custom OEE dashboard breaks cleanly into three layers, and keeping them separate is what makes the system maintainable as the plant's systems change underneath it.
Data Layer
The data layer connects to whatever the plant actually has: a PLC/OPC UA gateway for live machine signals, the MES for work orders and quality holds, and the historian for logged process tags. Its job is purely to normalize — different systems report downtime in different formats and units — before anything reaches the calculation engine.
Calculation Engine
OEE and downtime-reason attribution get calculated once, in the backend, not independently inside each view or report. That single-source-of-truth placement prevents the "two different OEE numbers in two different meetings" problem that plagues plants running a disconnected SaaS dashboard alongside their MES — every role sees a number computed the same way, from the same inputs.
Visualization Layer
The web client sits on top, with drill-down from a plant-wide OEE gauge down to a single machine's downtime log, and role-specific views: an operator sees the current shift, a supervisor sees the full line and today's Pareto, a plant director sees trend lines across sites. This mirrors how HMI dashboard design separates what different roles need on the floor itself — the same discipline applies one layer up, at the KPI level.
Rolling Out Without Losing the Floor's Trust
A new OEE dashboard — custom or SaaS — fails on the floor long before it fails technically, usually because operators stop trusting a number that doesn't match what they know happened on their shift. A phased rollout is what prevents that:
- Pilot on one line. Connect the data layer and calculation engine to a single, well-understood line first, and compare its OEE number against whatever manual or MES-based figure the team already trusts.
- Tune the downtime-reason logic. Reconcile mismatches between the dashboard's reason codes and what operators actually report — this step is where most of the early distrust gets resolved.
- Add role-specific views. Once the pilot line's numbers are trusted, build out the supervisor and plant-director views, each scoped to what that role actually needs to act on.
- Expand plant-wide. Extend the same data layer to additional lines and, eventually, additional sites — each new line is a marginal connection, not a new system.
What a Custom Build Costs Over Time vs. a SaaS Subscription
Without putting a specific number on either path — that depends entirely on the plant's systems and scope — the shape of the comparison is consistent. A SaaS subscription is predictable opex: a known cost per line or per user, renewed every year, with no large upfront outlay. But that cost compounds as the plant adds lines, sites, or users, and continues indefinitely with no point at which the plant "owns" the system outright.
A custom build inverts that shape: a larger upfront cost to design the data layer, calculation engine, and views, followed by a much smaller marginal cost to connect each additional line, since the hardest integration work — connecting to the plant's actual MES and historian — only has to happen once. The plant also avoids vendor lock-in on an integration specific to its own systems; migrating off a SaaS dashboard later generally means rebuilding that integration from scratch with a new vendor, while a system the plant owns doesn't carry that switching cost.
Frequently Asked Questions
- What's the difference between an OEE dashboard and a SCADA/HMI screen?
- A SCADA/HMI screen shows live machine state for an operator controlling a line right now. An OEE dashboard sits above that: it aggregates availability, performance, and quality data over time, usually across multiple lines, to answer a management question rather than a control question.
- Can a custom OEE dashboard pull data from multiple MES systems at once?
- Yes — that's usually the main reason to build custom rather than buy. A custom dashboard's data layer can connect to each MES or historian a plant already runs (common after acquisitions or multi-site rollouts on different platforms) and normalize the data before it reaches the calculation engine, which a single-vendor SaaS dashboard generally isn't built to do.
- How long does it take to build a custom OEE dashboard?
- As a rough range, a pilot covering one line with a working data connection, calculation engine, and basic web views can be delivered in a few months. A full role-based rollout across a plant, with downtime-reason logic tuned to the real process, typically takes longer — similar in scope to a phased MES or data-platform rollout.
- Do operators need training to use a custom dashboard vs. a vendor one?
- Both need some onboarding, but a custom dashboard can be built to mirror the downtime-reason codes and shift structure operators already use, instead of a vendor's generic taxonomy. A one-line pilot (see the rollout steps above) is what actually determines how much training is needed, more than whether the system is custom or off-the-shelf.
- What happens to OEE data ownership with SaaS dashboards vs. custom builds?
- With a SaaS dashboard, the vendor stores and processes the data on its own infrastructure, and export, retention, and access are governed by its terms. With a custom build, the plant owns the data layer and historian outright — which matters most to teams that want their own long-term analytics or don't want to depend on a vendor's roadmap for how long downtime history stays available.
- Can a custom dashboard still use off-the-shelf visualization tools (Grafana, Power BI)?
- Yes. "Custom" here usually refers to the data layer and calculation engine — the integration with the plant's actual MES, historian, and downtime logic — not necessarily a hand-built charting frontend. Pairing a custom data layer with Grafana, Power BI, or a similar tool is common, keeping the hardest, most plant-specific part owned while reusing mature tooling for the charts.

The data behind an OEE dashboard usually needs a longer-term home than the dashboard itself — see our guide to manufacturing data lake architecture for how aggregated plant data feeds broader analytics beyond the dashboard. If the OEE build is part of a larger decision about building versus buying plant software generally, our custom MES build-vs-buy framework covers the same tradeoff one layer down the stack, at the execution-system level.
Evaluating a custom OEE dashboard tied into your existing MES and historian? Talk to a Web Dashboard Development Team →